• Our team is looking to connect with folks who use email services provided by Plesk, or a premium service. If you'd like to be part of the discovery process and share your experiences, we invite you to complete this short screening survey. If your responses match the persona we are looking for, you'll receive a link to schedule a call at your convenience. We look forward to hearing from you!
  • The BIND DNS server has already been deprecated and removed from Plesk for Windows.
    If a Plesk for Windows server is still using BIND, the upgrade to Plesk Obsidian 18.0.70 will be unavailable until the administrator switches the DNS server to Microsoft DNS. We strongly recommend transitioning to Microsoft DNS within the next 6 weeks, before the Plesk 18.0.70 release.
  • The Horde component is removed from Plesk Installer. We recommend switching to another webmail software supported in Plesk.

Unusual high CPU and I/O

JurgenN

New Pleskian
My VPS experiences very high CPU and I/O usages, according to a structural pattern. I don't have a clue what to do about it, or even where to look for problems. It's an unmanaged VPS, so I cannot ask my host for help.

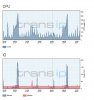
It seems that every 12 hours there's a major spike, and in between there are minor spikes, but it's seems there is a structural pattern. So I guess there is some automatic periodic service that is the cause. I wonder if anyone can shed some lights on this. I run Centos 6.3 + ASL + Plesk 11.0.9

Here are some pics and logs to show what's going on.
 

Attachments

  • Image1.jpg
    Image1.jpg
    151.5 KB · Views: 9
  • log.txt
    13.9 KB · Views: 2
Last edited:
Probably caused by daily cron, log rotation or something.

No offense, but this image is useless for us, we can't get any information from it, we can only see the charts.

Anyway, since you know exactly the tme when this happens, try to be online at that time and check logs/top what is going on (also check when your daily scheduled crons are running).

Also please check for big size of the logs, maybe that is causing the problem, I had same problem with logs.

Maybe my script helps you with checking the logs:
http://forum.parallels.com/showpost.php?p=671791&postcount=8
 
Thanks for your reply. I know the picture is useless in the technical sense, it was just an illustration to show the spikes.
That's why I also attached the log file. The point is, I'm relatively new and inexperienced in managing a VPS, when it comes to these kind of problems. Learning everyday, but here I need a helping hand. I just don't know how to interpret the log file and what steps I need to do. I can see high numbers, but then what? I'm rather clueless on what they mean, and what should be normal, and what to do about it.

What do you mean by "top"?

I'll have a look at the thread you mentioned. Thanks.
 
Back
Top