• Our team is looking to connect with folks who use email services provided by Plesk, or a premium service. If you'd like to be part of the discovery process and share your experiences, we invite you to complete this short screening survey. If your responses match the persona we are looking for, you'll receive a link to schedule a call at your convenience. We look forward to hearing from you!
  • The BIND DNS server has already been deprecated and removed from Plesk for Windows.
    If a Plesk for Windows server is still using BIND, the upgrade to Plesk Obsidian 18.0.70 will be unavailable until the administrator switches the DNS server to Microsoft DNS. We strongly recommend transitioning to Microsoft DNS within the next 6 weeks, before the Plesk 18.0.70 release.
  • The Horde component is removed from Plesk Installer. We recommend switching to another webmail software supported in Plesk.

Resolved Metric request error

Kniar

Basic Pleskian
Hello,

I can't get Advanced Monitoring to work on my Plesk Obsidian 18.0.35 (CentOS 7). The graphs are empty and I get "Metric request error" in the corner of all graphs.

I tried uninstall/reinstall Advanced Monitoring and Grafana but no change. The server is full updated and has no problem detected but this one.

Any idea for me ?
 
Hi,

I am facing the same problem after Grafana has been updated to the most recent version.

Code:
"Failed to start plugin" logger=plugins.backend pluginId=grafana-simple-json-backend-datasource error="Incompatible API version with plugin. Plugin version: 1, Client versions: [2]"

This plugin "grafana-simple-json-backend-datasource" is deprecated now since it uses an outdated API. Unfortunately, it is being used by Plesk Advanced Monitoring.
 
Hi there
I am also facing same problem after latest Update
I am running latest plesk on Ubuntu 20.x
Here I read -> Bug with ID EXTPLESK-2710 that will be fixed in future updates of the Advanced Monitoring extension.
Any ETA for this be fixed by Plesk?
Thanks,
Paco
 
Yes, last week we had finished work on the fix, and now to continue using Plesk with Grafana8 just need to update Advanced Monitoring and Grafana extensions on the server to the latest version.

Code:
Advanced Monitoring 1.4.3 (19 June 2021)
* [*] Installing Advanced Monitoring no longer  automatically installs the Grafana extension
      because Grafana  has changed its  licenses. When you  install Advanced  Monitoring now,
      Plesk will prompt you to install the Grafana extension as well and show the button you
      need to click to automatically install the extension.
* [-] Updating Grafana to version 8.0 and later no longer breaks the extension. (EXTPLESK-2710)
      Note: To use Advanced  Monitoring 1.4.3 with Grafana 8.0, you need to have the Grafana
      extension version 1.2.3.

Grafana 1.2.3 (18 June 2021)
* [-] Resolved compatibility issues with Grafana 8.0. (EXTPLESK-2710)
      Note: To use the upcoming Advanced Monitoring version 1.4.3 with Grafana 8.0, you need
      to have the latest version of the Grafana extension.


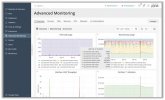
Grafana8.jpg
As you can see, while we were fixing the issue, Plesk continued to collect metrics about the system and after the fix, all these data become available again, there are no blank spaces.
 
Back
Top